Calculating rolling averages with Laravel Collections
As developers, we often find ourselves working with collections of data in our projects. Whether it's stock price data, weather readings, or server response times, this data can often be very noisy - lots of extreme, short, jumps and falls! This noisiness can make it really difficult to spot long term trends in the data. In many cases, we aren't concerned so much with the latest value in the data series, as the overall trend or direction the data is moving in. Enter rolling averages!
I already know what a rolling average is - take me straight to the code!
What are rolling averages?
A rolling average is a statistical calculation that takes a series of values and calculates the average of a subset of those values over a sliding window. This is useful in a variety of situations where we want to smooth out time-series data, create moving averages, and more. It can help us spot trends within our data, and can be really useful for things like future forecasting.
For example, let's say we have a set of series of temperature readings for a given 3 month period:
$temperature = collect([
    ['date' => '2021-04-01 00:00:00', 'value' => 9.7],
    ['date' => '2021-04-02 00:00:00', 'value' => 13.5],
    ['date' => '2021-04-03 00:00:00', 'value' => 14.4],
    .....
    ['date' => '2021-06-28 00:00:00', 'value' => 21.6],
    ['date' => '2021-06-29 00:00:00', 'value' => 21.8],
    ['date' => '2021-06-30 00:00:00', 'value' => 18.3]
]);
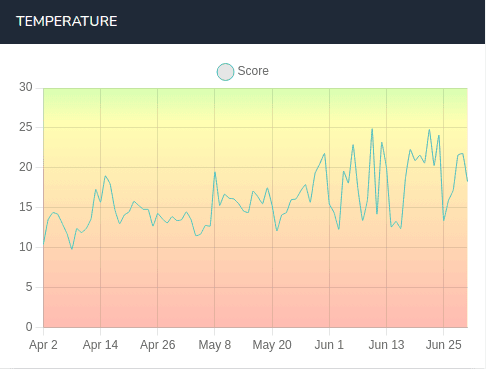
If we graph that data, we can see that there's been a bit of movement in the daily temperature over this period - fairly steady initially, but changing quite a bit as time went on!

Daily temperature readings
While this graph has a lot of information, it's not the easiest to read. The wild spikes towards the end of the quarter make it hard to see what the average temperature during the time is - are those spikes short-lived outliers, or are they bringing the general trend up? We want to be able to see easily what direction the trend is heading in. Let's try adding a rolling average.
To calculate the rolling average, each data point is the average of all data points which preceded it, e.g:
| Day | Value | Rolling Average | Calculation |
|---|---|---|---|
| 1 | 5 | 5 | 5 / 1 |
| 2 | 7 | 6 | 12 (5+7) / 2 |
| 3 | 3 | 5 | 15 (5+7+3) / 3 |
| 4 | 5 | 5 | 20 / 4 |
| 5 | 10 | 6 | 30 / 5 |
| 6 | 3 | 5.6 | 33 / 6 |
| 7 | 5 | 5.2 | 38 / 7 |
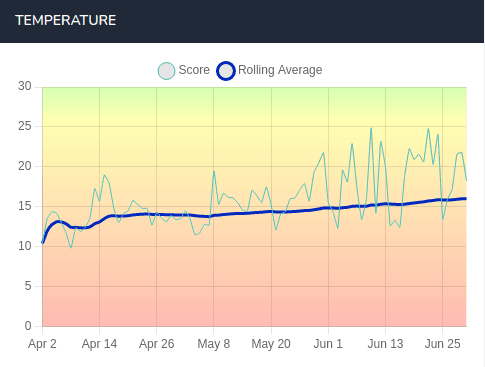
When we add the rolling average to our quarterly temperature graph, we can see a definitive trend in the data.

Rolling average of temperature
This type of graph allows us to quickly draw conclusions about the direction the data is moving in, with the noise of daily spikes mostly removed.
However, we'll face a challenge here as our data sets get larger. The bigger the data set, the more "settled" the average typically gets, which can lead to misleading conclusions, particularly when dealing with seasonal data. We can refine our approach a little further by limiting the number of values we use to build our rolling average. Perhaps we're graphing sales for the year, but know that within a given week, demand can spike and fall quite a bit (weekends busy, mid-week quiet). So in this case, we are happy to average the last 7 days of sales on each given day, to "smooth out" this effect. In the example below, let's consider a 2-day rolling average, compared to a "full set" average.
| Day | Value | 2-day avg | "Full set" avg |
|---|---|---|---|
| 1 | 1 | 1 | 1 |
| 2 | 2 | 1.5 | 1.5 |
| 3 | 3 | 2.5 | 2 |
| 4 | 4 | 3.5 | 2.5 |
| 5 | 5 | 4.5 | 3 |
| 6 | 6 | 5.5 | 3.5 |
In this case, we can see that the 2-day rolling average is moving more in line with the latest values in the set, helping to give us a better picture of more recent activity. (In practice, we'd use a longer window than 2 days, as 2 days is very prone to being influenced by single outlier values.)
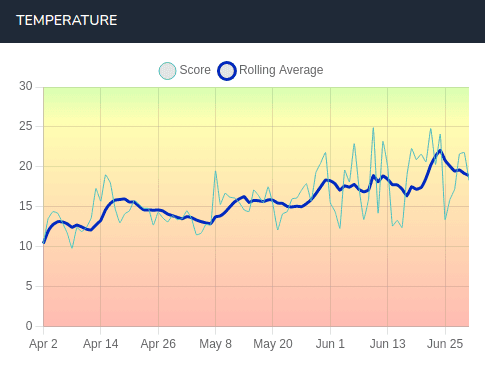
Let's apply this to our temperature case. The previous temperature graph shows a slow and steady rise of temperatures from April to June, but let's take a look at how much the temperature has been moving on a week-to-week basis. We can do this by applying a 7-day rolling average:

7-day rolling average
This looks pretty different! Not so much the smooth and steady progression of the overall average, but instead something which gives us a good idea of sustained movement in the short-term. Fine-tuning the period we use for a rolling average is key - we want detailed enough information to spot significant changes in the overall trend, but don't want so much data that we get stuck in the noise. 7- and 30-day rolling averages are relatively common ways to attempt to remove some short-term seasonality from results, so they may be good candidates to start with when exploring this on your own data!
Ok, great, I'm sold on rolling averages being a way to get a useful signal from noisy data! But what if my use case is the opposite - I have a lot of data points where the values are relatively stable, and it's the small changes between them which I want to be more aware of. Can rolling averages help me here?
Rolling, weighted averages
There are cases where we have a number of data points, and want to give outsized importance to more recent values. If you're dealing with sales data in an FMCG context, perhaps the last few data points should have 10x the importance of those before them when it comes to inventory planning. Or when monitoring environmental data, such as temperature or air quality, recent data points may be more indicative of the current conditions than older data points. Applying weights to a rolling average can help you create a more accurate picture of the current conditions by giving more weight to recent data points.
In this example, we're calculating a rolling average of the last 4 entries, and applying a 5x multiplier to the most recent value, with a 2x multiplier to the second-most-recent value:
$data = new Collection([1, 2, 2, 4, 5, 6]);

// Weights will be applied in the order of current data point
// N, then N-1, and so on.
// Where no weighting exists, a default of 1 is used.
$weights = new Collection([5, 2]);

/**
 * Weighted rolling average of last 4 available entries:
 * 5,      // 1 * 5
 * 6,      // (2 * 5) + (1 * 2) / 2
 * 5,      // (2 * 5) + (2 * 2) + 1 / 3
 * 6.75,   // (4 * 5) + (2 * 2) + 2 + 1 / 4
 * 9.25,   // (5 * 5) + (4 * 2) + 2 + 2 / 4
 * 11.5,   // (6 * 5) + (5 * 2) + 4 + 2 / 4
 */
| Value | Rolling avg | Weighted rolling avg |
|---|---|---|
| 1 | 1 | 5 |
| 2 | 1.5 | 6 |
| 2 | 1.67 | 5 |
| 4 | 2.25 | 6.75 |
| 5 | 3.25 | 9.25 |
| 6 | 4.25 | 11.5 |
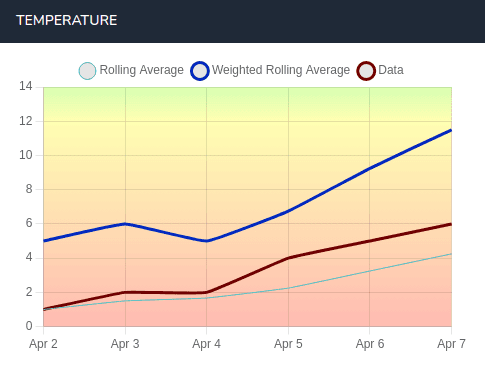
When we compare the original data series to the rolling, weighted average, we can see growth in both, but in a much more pronounced, attention-grabbing way once weighted. Our weighted average values help to highlight trends - in this case, by placing a higher weight on more recent results.

Weighted rolling average
Ok, great - I'm sold! Rolling averages sound really useful. How do I go about using them in my Laravel project?
Extending Laravel Collections If you are a PHP developer, you may already be
familiar with
Collections
within Laravel. They are a powerful tool for manipulating arrays in a more
expressive and convenient way. One of the key benefits of collections is their
ability to be extended. Adding a new function to any collections in Laravel is
as simple as adding a macro in the AppServiceProvider ...
use Illuminate\Support\Collection;
...
class AppServiceProvider extends ServiceProvider
{
    public function register()
    {
        // Add the pluralised form of "banana" to each entry
        Collection::macro('bananafy', function () {
            return $this->map(function($item) {
                return $item.' banana'.($item != 1 ? 's' : '');
            });
        });
        ...
    }
}
.. and then calling your new function from any collection in your code:
collect([1, 2, 3])->bananas();

'1 banana',
'2 bananas',
'3 bananas'
The above example isn't hugely useful outside the rarified world of professional banana counting, but shows how simple it is to extend core Collection functionality. Spatie have taken this even further, creating a package with lots of handy collection macros. We can use a similar approach to add our opinionated rolling average functionality.
/**
 * Rolling average macro.
 *
 * @param int $recordsToAverage  How many records to look back when creating the average
 * @param bool $enforceLookback  Only average $recordsToAverage values, i.e. if asked to average 5 entries,
 *                               don't attempt to average anything until the 5th entry.
 * @param Collection $weightings Weightings to apply to values. This allows different importance
 *                               to be applied to different values. First value is applied to most
 *                               recent addition to rolling average.
 */
Collection::macro('rollingAverage',
    function (
        int $recordsToAverage = null,
        bool $enforceLookback = false,
        Collection $weights = null
    ) {
    ...
}
Once this macro is created in the AppServiceProvider, it's now available to all collections within your application:
$data = collect([1, 2, 3, 4, 5, 6])
            ->rollingAverage();

// OUTPUT
[
    1,
    1.5,
    2,
    2.5,
    3,
    3.5
]
We at Square1 have bundled this implementation up into an easy-to-use package, which provides a simple, convenient way to calculate rolling averages in your Laravel projects. The package is easy to install and use, and we think that it's a great addition to your data manipulation toolkit!
Installation
To use the package, simply install it using Composer and then call the rollingAverage method on your Laravel collection. The package is well-documented and easy to use, so you can start calculating rolling averages in no time.
composer require square1/laravel-collection-rolling-average
Our package also includes options for specifying the number of data points to include in your rolling average, as well as applying custom weights to the average calculation.
$data = new Collection([1, 2, 3, 4, 5]);

$averages = $data->rollingAverage();
/**
 *   1,      // 1
 *   1.5,    // 1+2 / 2 (only 2 entries seen so far)
 *   2,      // 1+2+3 / 3
 *   2.5,    // 1+2+3+4 / 4
 *   3       // 1+2+3+4+5 / 5
 */

//------------------------------
// How many entries should we consider in our average?
$averages = $data->rollingAverage($lookback = 2);
/**
 * Looking back over last 2 entries:
 *   1,      // 1
 *   1.5,    // 1+2 / 2
 *   2.5,    // 2+3 / 2
 *   3.5,    // 3+4 / 2
 *   4.5,    // 4+5 / 2
 *   5.5     // 5+6 / 2
 */

//------------------------------
// Weights will be applied in the order of current data point
// N, then N-1, and so on.
// Where no weighting exists, a default of 1 is used.
$weights = new Collection([5, 2]);

$averages = $data->rollingAverage(
    $lookback = 4,
    $excludeUntilLookbackEntriesSeen = false,
    $weights
);

/**
 *   5,      // 1 * 5
 *   6,      // (2 * 5) + (1 * 2) / 2
 *   5,      // (2 * 5) + (2 * 2) + 1 / 3
 *   6.75,   // (4 * 5) + (2 * 2) + 2 + 1 / 4
 *   9.25,   // (5 * 5) + (4 * 2) + 2 + 2 / 4
 *   11.5,   // (6 * 5) + (5 * 2) + 4 + 2 / 4
 */
Whether you are working with financial data, weather data, or any other kind of time-series data, this package provides a simple, convenient way to gain insights into long-term trends and patterns. Give it a try and see how it can benefit your projects!
PHP UK Conference, London 2026
In February 2026, I'll be speaking at the PHP UK Conference in London. I'll be telling the story behind EverythingIsShowbiz.com, a site that went from a vibe-coded side project, to a useful experiment in integration of AI into PHP workflows.
Get your ticket now and I'll see you there!
